




 Get to WhatsApp

Our manager will contact you
within 15 minutesт
Marketing Budget Planning: How Much to Spend on Digital Marketing
Strategy First, Spending Second
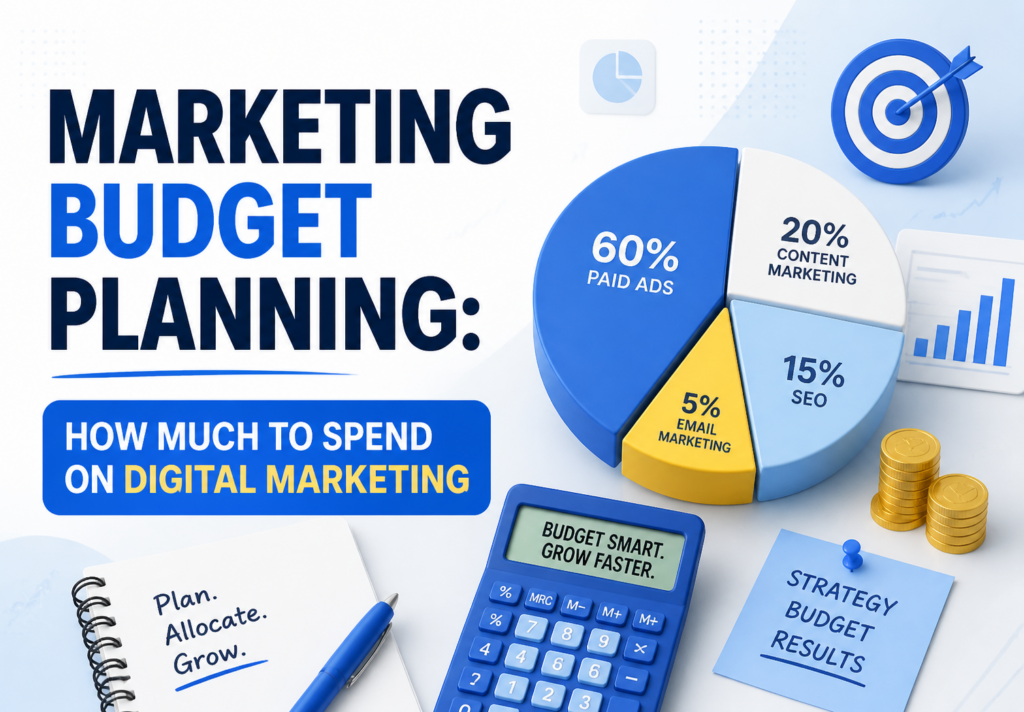
Marketing Budget Planning: How Much to Spend on Digital Marketing
Marketing is the most essential component of launching and growing any business in a competitive environment. And the most important decision within it is not how much to spend — it’s which instruments to use, in what order, at what investment level. In this guide we share the frameworks and channel-level data that businesses around the world use to make these decisions. From traffic acquisition channels to realistic cost ranges and timelines to first measurable results.
What’s Inside This Guide
1. Why Most Budget Allocation Decisions Fail — and What to Do Instead.
2. The Real Economics of Each Digital Channel — Cost, Timeline, and Return Profile.
3. The Measurement Infrastructure That Makes Allocation Decisions Possible.
4. Practical Allocation Frameworks for Different Business Stages.
5. Building a Twelve-Month Investment Plan That Adjusts as You Learn.
Why Most Budget Allocation Decisions Fail — and What to Do Instead
Quick answer:
There is no universal percentage of revenue to allocate to promotion that applies to every business in every situation. The right investment level depends on your competitive environment, your growth stage, your margin structure, and the specific channels you’re using — because different channels produce returns on dramatically different timelines and at dramatically different cost-per-acquisition levels. What this guide provides is the channel-level specificity needed to make an informed allocation decision rather than defaulting to an industry average that may not reflect your situation at all.
The most common approach to planning a promotion investment is to look at what competitors are doing, ask what industry benchmarks suggest, and then divide that figure across the available channels in rough proportion to how much attention each channel receives in blog posts and conference presentations. The outcome of this approach is consistently the same: money distributed across too many channels at insufficient investment levels to produce meaningful results in any of them, with no clear attribution of which activities are driving which outcomes, and no clear framework for adjusting allocation when the initial assumptions don’t hold.
The alternative approach starts from channel economics rather than from competitor behavior or industry averages. Each digital marketing channel has a specific return profile — a cost structure, a timeline to first results, a conversion rate range relative to traffic quality, and a diminishing returns curve that determines how much additional investment produces diminishing marginal returns. Understanding these profiles before allocating any investment allows you to sequence channels by priority — starting with the channels that produce the fastest return at the lowest investment threshold — rather than attempting to run everything simultaneously at inadequate scale.
The sequencing principle is the most important concept in promotional investment planning that most guides don’t explain clearly enough. The channels that produce the fastest returns at the lowest cost — typically organic search optimization and targeted paid search for established businesses — should be established and producing measurable results before significant investment is shifted to channels with longer return timelines and higher cost-per-acquisition thresholds. A business that invests heavily in brand social content and influencer campaigns before establishing a functional paid search program and a technically sound organic presence has prioritized brand awareness over revenue attribution — which is appropriate for certain business models and deeply inappropriate for most others. Understanding the guide on how to build a digital marketing team helps clarify which skills and roles are needed at each stage of investment scaling.
📌 The Four Questions That Should Drive Every Allocation Decision:
What is the fastest route to first revenue attribution? Start with the channels that produce measurable leads or sales in the shortest timeframe — not the most impressive-looking programs.
What is the competitive threshold in each channel? Some channels require minimum investment levels to produce any results — spending below threshold is wasted investment.
What is the attribution infrastructure in place? Investment without measurement produces data that can’t inform decisions — infrastructure precedes channel investment.
What is the realistic timeline to positive ROI in each channel? Planning around realistic timelines prevents premature abandonment of channels that require sustained investment to produce returns.
The measurement infrastructure question is particularly important because it is the one most frequently deferred in favor of “getting campaigns running” before the tracking systems are ready. Investment in any channel without proper attribution infrastructure — conversion tracking, UTM parameter consistency, CRM integration, and attribution model documentation — produces spending without learning. You may generate leads or sales from the investment, but you won’t know which channel, campaign, or specific ad generated which outcome, which makes every subsequent allocation decision a guess rather than an informed choice. Building the measurement layer first — even if it delays the first campaign by two to three weeks — produces better long-term decisions than launching campaigns without the ability to measure what’s working.
The Real Economics of Each Digital Channel — Cost, Timeline, and Return Profile
The honest description of each digital channel’s economics includes three numbers that are almost never presented together in single-channel marketing content: the investment required to produce results at a scale that meaningfully affects the business, the timeline from investment start to first measurable return, and the typical cost-per-acquisition across comparable industries. These three numbers together allow genuine comparison between channels — not on the basis of which channel is theoretically best but on the basis of which channel produces the right return profile for the specific business situation being evaluated.
Paid search is the fastest route to measurable lead and sale attribution for most established businesses with a proven product or service and a functional landing page infrastructure. The investment required to generate meaningful data — enough impressions, clicks, and conversions to make statistically reliable decisions about campaign performance — varies significantly by industry. In low-competition categories, $1,500 to $3,000 per month in ad spend may produce meaningful inquiry volume. In competitive categories like legal, medical, insurance, and financial services, the cost-per-click economics require $5,000 to $15,000 per month in ad spend to generate sufficient volume for reliable optimization. The timeline to first measurable results is typically one to three weeks — which is why paid search is the appropriate first channel for businesses that need revenue attribution data quickly rather than building long-term organic authority over months.
Organic search optimization operates on a fundamentally different timeline but produces returns that compound over time in a way that paid search cannot replicate. A business that ranks in position one for a target query captures traffic continuously — every week, every month — without paying for each click. The compounding nature of organic authority means that the channel produces increasing returns per dollar invested as the campaign matures, while paid search produces roughly linear returns that stop immediately when investment stops. The investment required and the timeline to results vary significantly by competitive environment — detailed breakdowns of what specific investment levels produce in different markets are available through the guides on Ahrefs and Semrush, which are the two tools most commonly used to evaluate competitive gap and investment requirements before campaign planning.
📈 Channel Return Profile Summary — What Each Channel Actually Delivers:
Paid search: Fast results (1–3 weeks), direct attribution, high CPC in competitive markets, stops when investment stops. Best for: established businesses needing immediate lead volume.
Organic search: Slow start (3–6 months), compounding returns, continues delivering after initial investment. Best for: long-term patient capital allocation with compounding ROI expectations.
Paid social: Medium speed (2–6 weeks for optimization), strong for awareness and retargeting, weaker for direct purchase intent. Best for: B2C, e-commerce, and brand building alongside performance campaigns.
Email: Immediate for existing lists, requires list building time for new programs. Highest ROI per dollar of any channel once list is established. Best for: retention, reactivation, and nurture programs.
Content and SEO compound: 6–18 months to meaningful organic traffic, produces compounding authority. Best for: businesses with patience and long-term revenue orientation.
Digital Marketing Channel Investment Reference
| Channel | Typical Monthly Investment | Timeline to First Measurable ROI |
|---|---|---|
| Google Search Ads (paid) | $1,500 – $15,000+ ad spend + management | 1–3 weeks for first conversions; 4–8 weeks for optimization |
| Organic search optimization (SEO) | $1,500 – $5,000/month all-inclusive | 3–6 months for first movement; 8–14 months for competitive positions |
| Facebook / Instagram Ads | $1,000 – $8,000+ ad spend + management | 2–6 weeks for audience optimization; 60–90 days for reliable ROAS |
| LinkedIn Ads (B2B) | $2,000 – $10,000+ ad spend | 4–12 weeks — high CPC requires patience for pipeline attribution |
| Email marketing (existing list) | $300 – $1,500/month (platform + creative) | Immediate for first send; highest ROI of any channel at scale |
| Content production (blog + distribution) | $1,000 – $4,000/month | 60–120 days per piece to ranking traction; 6–12 months for compound effect |
| YouTube advertising | $500 – $5,000+ ad spend + production | 4–8 weeks for audience learning; direct attribution difficult for brand campaigns |
| Influencer and partnership campaigns | $500 – $50,000+ depending on scale | Immediate for awareness; 60–180 days for brand authority accumulation |
| Retargeting / remarketing | $400 – $2,000/month ad spend | Requires 4–6 weeks of audience building; results at week 6–10 |
The Measurement Infrastructure That Makes Allocation Decisions Possible
Every allocation decision made without proper measurement infrastructure is essentially a guess — an expensive guess that may produce revenue but won’t produce the learning needed to optimize future allocation decisions. The measurement layer is not a technical luxury for large organizations with dedicated analytics teams; it is the minimum prerequisite for any business spending more than a few hundred dollars per month on promotion. Without it, you cannot know which channels are working, which campaigns within those channels are producing results, or how your cost-per-acquisition compares to your customer lifetime value — the fundamental calculation that determines whether any promotional investment is profitable.
The foundation of marketing measurement is conversion tracking — the technical implementation that records when a visitor completes a commercially meaningful action (form submission, phone call, purchase, or booking) and attributes that action to the campaign, channel, and specific advertisement that produced the visit. Google Analytics 4 and the advertising platform pixels (Google Ads conversion tracking, Meta Pixel) provide this tracking for paid channels. Google Search Console provides the organic search equivalent — recording which queries generated impressions and clicks to which pages, allowing attribution of organic traffic to the content and page decisions that produced it.
UTM parameter consistency is the operational discipline that makes multi-channel attribution reliable. When every link driving traffic to the site — from paid campaigns, email sends, social posts, and partner referrals — carries consistent UTM parameters, Google Analytics 4 can attribute sessions, conversions, and revenue to each source accurately. Without this consistency, a significant proportion of traffic appears as “direct” — which means the channel attribution data is incomplete and allocation decisions based on it are correspondingly unreliable. The implementation is not technically complex but requires consistent application across every team and channel — which is why documenting the UTM convention and training everyone who manages campaigns is a prerequisite for reliable multi-channel attribution.
For businesses tracking traffic growth as a leading indicator of organic performance, the guide on how to get 1,000 visitors a day covers the specific content volume and authority-building methodology required to reach meaningful organic traffic thresholds — which provides useful calibration for setting realistic organic traffic milestones within a twelve-month investment plan.
⚙️ Measurement Infrastructure Checklist — Verify Before Spending on Any Channel:
▶ GA4 installed and configured: Events tracking form submissions, phone clicks, purchase completions, and key engagement milestones — not just pageviews.
▶ Google Ads conversion tracking active: Conversion actions imported from GA4 or implemented via the Google Ads tag — verified as recording conversions for test transactions.
▶ Meta Pixel installed with standard events: Purchase, lead, and contact events firing correctly — verified in Meta Events Manager before campaign launch.
▶ UTM convention documented and applied: Every campaign link tagged consistently — source, medium, campaign, content parameters standardized across all teams.
▶ CRM integration active: Lead data flowing from web forms to CRM with source attribution — so offline revenue can be traced back to the digital touchpoints that generated the lead.
The code implementation that matters most for conversion tracking accuracy is the placement of the conversion event tag relative to the form submission or purchase completion event. A common implementation error is placing the tracking tag on the thank-you page URL rather than on the form submission event itself — which means that any visitor who submits the form and then navigates to the thank-you page through a different path, or whose browser blocks the redirect, doesn’t get counted as a conversion. The more reliable implementation fires the conversion event on form submission using the tag management system:
// GTM - Form submission trigger (fires on successful form submit)
Trigger type: Form Submission
Fire on: All Forms — or specify by form ID
Enable when: Page URL matches /contact/ OR /services/

// Verification in GTM Preview mode:
// Submit the form → confirm tag fires → check GA4 DebugView
Practical Allocation Frameworks for Different Business Stages
The allocation framework that works for a bootstrapped startup with $3,000 per month to invest in promotion is fundamentally different from the framework appropriate for a Series B company with $200,000 per month available. The principles are the same — prioritize channels by return timeline, invest above minimum threshold in each channel before adding new ones, and measure everything — but the specific channel priorities and investment proportions differ significantly based on the business’s stage, revenue base, and growth objectives.
For early-stage businesses with limited promotional investment capacity, the correct priority sequence is typically: establish organic search presence through technical foundation and initial content — this is the lowest-cost long-term traffic channel and the returns compound indefinitely once established. Simultaneously, run tightly targeted paid search campaigns focused on the highest-intent queries in the lowest-cost sub-categories of the target market — this provides immediate lead attribution data while the organic foundation builds. Email list building from day one — even with a small list — establishes the highest-ROI channel for future use as the list grows. Social media presence for trust-building and retargeting audience accumulation, not as a primary lead generation channel at this stage. The total investment at this stage: $2,500 to $5,000 per month covering all channels, with the largest proportion going to paid search for immediate attribution and organic for long-term compounding.
🎯 Budget Allocation by Business Stage — Illustrative Frameworks:
Early stage ($2,000 – $5,000/month total): 40% paid search, 35% organic SEO, 15% content production, 10% email infrastructure. Focus: revenue attribution and organic foundation.
Growth stage ($5,000 – $20,000/month): 30% paid search, 25% organic, 20% paid social, 15% content, 10% email. Focus: scaling proven channels while adding new acquisition paths.
Scale stage ($20,000+/month): 25% paid search, 20% organic, 20% paid social, 15% content, 10% email, 10% brand/influencer. Focus: multi-channel attribution and retention investment.
Enterprise ($100,000+/month): Allocation by attributed ROAS — each channel funded to its diminishing returns threshold. Infrastructure and talent investment increases as proportion of total.
- ► Never split investment across more channels than you can fund above minimum threshold simultaneously — below-threshold investment produces zero results, not proportional results
- ► Establish clear attribution before adding new channels — adding channels without knowing which existing ones are working leads to over-investment in underperforming channels and under-investment in high-performing ones
- ► Allocate a fixed percentage of new channel investment to testing — 10 to 15 percent of total investment reserved for channels and experiments not yet proven at scale, with clear metrics defining what success looks like before the test begins
- ► Review allocation quarterly against attribution data — the right allocation changes as markets change, as competitive intensity shifts, and as each channel’s performance data accumulates
- ► Account for total channel cost — not just ad spend but also management, creative production, tool subscriptions, and reporting time — when comparing channel ROI across options
Building a Twelve-Month Investment Plan That Adjusts as You Learn
The most common failure mode in annual promotional planning is treating the twelve-month plan as a fixed budget document rather than as a dynamic allocation framework that adjusts quarterly based on what attribution data reveals. A plan that allocates equal investment to each channel for each month, regardless of what performance data shows in months two through four, is not a plan — it’s an assumption. Real planning combines initial allocation decisions based on the frameworks above with explicit decision rules that define when and how allocation shifts based on measured performance.
The quarterly review process is where the dynamic adjustment happens. At the end of each quarter, the review compares three things: the attributed cost-per-acquisition for each channel against the target CPA established at the planning stage, the total volume produced by each channel against the volume targets in the plan, and the leading indicators for channels with longer attribution timelines — organic impressions growth, email list growth rate, retargeting audience size — that predict future performance before revenue attribution is measurable. Channels that are performing above CPA targets receive increased allocation in the following quarter. Channels that are performing below volume targets despite meeting CPA thresholds receive optimization work rather than increased budget. Channels that are performing below both volume and CPA targets are either restructured or de-prioritized in favor of channels producing better returns.
The twelve-month content plan is a component of this broader allocation framework that deserves specific treatment because its returns are the most difficult to attribute through standard conversion tracking and the most tempting to cut when under short-term revenue pressure. A digital marketing program that cuts content investment in response to a quarterly revenue shortfall is sacrificing the compound-return asset that produces the best long-term cost-per-acquisition in favor of short-term cash conservation — a trade that typically makes the long-term problem worse by removing the organic visibility that would have reduced future paid acquisition costs. Protecting content investment through short-term performance volatility is one of the harder discipline questions in promotional planning, but the businesses that maintain consistent content investment through difficult quarters consistently emerge with stronger organic positions than competitors who cut.
Twelve-Month Digital Marketing Investment Plan — Channel by Channel
| Channel / Activity | Priority Level | When to Start |
|---|---|---|
| Conversion tracking and UTM setup | Critical prerequisite | Week 1 — before any paid investment begins |
| Google Search Ads (high-intent keywords) | High — immediate revenue attribution | Month 1 — after tracking is confirmed functional |
| Technical SEO foundation and audit | High — enables all organic returns | Month 1 — concurrent with paid campaign launch |
| Core service page optimization (on-page) | High — first organic positioning layer | Month 1–2 — follow technical audit completion |
| Email list building and first sequence setup | High — highest long-term ROI | Month 1 — starts small, compounds over time |
| Content production (blog, guides) | Medium-high — organic authority building | Month 2 — after technical foundation is in place |
| Retargeting campaigns (Google, Meta) | Medium — requires traffic to build audiences | Month 2–3 — after 4–6 weeks of site traffic accumulation |
| Meta / Instagram Ads (prospecting) | Medium — strong for B2C and e-commerce | Month 2–3 — once creative assets are production-ready |
| Link acquisition campaign (editorial) | Medium-high — organic authority compound | Month 2–3 — ongoing throughout the year |
| LinkedIn Ads (B2B pipeline) | Medium — high CPC requires longer ROI timeline | Month 3–4 — after initial paid search data is in |
| YouTube channel and video content | Medium — trust-building, organic compound | Month 4–6 — after core channels are optimized |
| Influencer and partnership programs | Lower priority initially — brand awareness | Month 6+ — once revenue attribution baseline exists |
| CRO (conversion rate optimization) tests | High — multiplies returns from all traffic channels | Month 3–4 — requires statistical traffic volume first |
💰 Channel Cost-Per-Acquisition Benchmarks by Industry (Approximate Ranges):
Legal services: Paid search CPA $200–$800 per lead. Organic CPA $20–$60 per lead at maturity.
E-commerce (fashion/home): Paid social CPA $15–$60 per purchase. Email CPA $3–$12 per purchase.
SaaS / software: Paid search CPA $80–$400 per trial. Organic content CPA $15–$80 per trial at scale.
Healthcare / medical: Paid search CPA $100–$500 per appointment. Organic CPA $25–$90 per appointment at maturity.
Home services (HVAC, roofing, plumbing): Paid search CPA $40–$200 per lead. Organic CPA $8–$40 per lead at scale.
The digital marketing plan that produces the best twelve-month outcomes is not the most ambitious one — it is the one calibrated to what the business can execute with genuine competence at each stage. A plan that launches six channels simultaneously with insufficient investment in each, insufficient measurement infrastructure to evaluate any of them, and insufficient creative and analytical capacity to optimize them produces worse outcomes than a focused plan that does three channels well. The discipline of prioritization — choosing what not to do at this stage as explicitly as choosing what to do — is the mark of mature promotional planning, and it consistently produces better results per dollar invested than the alternative.
Frequently Asked Questions
❓ What percentage of revenue should a business spend on digital marketing?
The often-cited benchmark is 5 to 12 percent of gross revenue for established businesses and 12 to 20 percent for early-stage businesses investing in growth. These ranges are useful as sanity checks but not as planning tools. A business with 80 percent gross margins in a high-competition category can profitably invest 25 percent of revenue in promotion. A business with 15 percent margins in a low-competition category cannot afford that same percentage. The right investment level is determined by your margin structure, competitive environment, and the cost-per-acquisition your channels produce relative to your customer lifetime value — not by an industry percentage benchmark.
❓ Which digital channel delivers the fastest return on investment?
For established businesses with proven products or services and functional landing pages, paid search consistently delivers the fastest measurable return — first conversions typically within one to three weeks of campaign launch. The trade-off is that the return stops immediately when investment stops, and cost-per-acquisition in competitive categories can be very high.
Email marketing delivers higher ROI per dollar than any other channel once a list is established — but requires time to build the list before that ROI is accessible. For businesses with existing customer databases, email reactivation campaigns often produce the highest short-term return of any channel with minimal investment.
❓ Is it better to manage digital channels in-house or through an agency?
The practical limitation for most businesses is that in-house management requires full-time specialists who are expensive to hire and difficult to retain, while agency management provides access to experienced practitioners without the overhead of full-time employment. The hybrid model — where in-house generalists manage strategy, reporting, and channel coordination while specialized agencies manage specific high-skill components like paid search and organic search optimization — produces better outcomes per dollar for most businesses than either fully in-house or fully outsourced approaches.
❓ How do I know if my current investment is being wasted?
If you cannot attribute specific revenue or lead volume to specific channels and campaigns with reasonable confidence, the investment may be generating results you’re not measuring rather than results that don’t exist — but the inability to measure is itself a problem that needs fixing. Pull your Google Analytics 4 channel report, your paid platform conversion reports, and your CRM lead source data. If they don’t tell a consistent story about which channels are producing which outcomes, the measurement infrastructure needs remediation before any allocation decisions are meaningful.
❓ When should a business start investing in organic search if it needs revenue now?
Immediately — but as a parallel track, not as a substitute for paid acquisition. Organic search produces compounding returns that begin accruing from the first month of technical and content investment, even though those returns don’t become significant for six to twelve months. A business that delays organic investment until paid channels are “stable” typically delays its organic return timeline by the same duration — and loses the months of compounding authority building that would have reduced paid acquisition costs later. Start organic investment as early as the budget allows, even at a modest scale, and run it in parallel with whatever paid channels are producing short-term returns.
❓ How should I allocate budget between traffic acquisition and conversion rate optimization?
Until you have statistically significant traffic to your conversion pages — typically several hundred monthly sessions per page — there isn’t enough data to run reliable CRO tests, and the investment is better directed to traffic acquisition. Once you reach that traffic threshold, allocating 10 to 15 percent of total investment to CRO typically produces disproportionate returns because conversion rate improvements multiply the ROI of every traffic channel simultaneously.
A 20 percent improvement in landing page conversion rate effectively reduces the cost-per-acquisition of every channel by 20 percent — which is often more valuable than the same investment in additional traffic.