


 Get to WhatsApp

Our manager will contact you
within 15 minutesт
The Complete Google Ads Cost Reduction Guide 2026
How to Lower CPC & Optimize Your Budget Across 3 Channels

The Complete Google Ads Cost Reduction Guide
Hello, my respected reader! Why do click rates in Google Ads keep rising, and is there anything you can actually do about it? Lately, clients have been coming to me more and more often asking for help understanding and solving the problem of growing budgets and escalating bid costs. In this guide I will share everything I know about the complete Google Ads cost reduction — how to lower CPC and optimize your budget across 3 channels without sacrificing the quality of the leads you are generating. This is the most comprehensive resource I have put together on this topic. You can also order a comprehensive website audit from my agency to identify growth opportunities through organic search and start getting clients without regular ad spend. Get a free work plan within 12 hours.
12 years of Google Ads experience distilled into one guide — for professionals who are tired of burning budget and not understanding why
⚡ Quick Answer
Rising click costs in paid search are almost never caused by one thing alone. In the vast majority of cases, the problem is a combination of targeting settings that have drifted from their original configuration, a website that does not convert the traffic it receives, bidding strategies operating without sufficient data to make intelligent decisions, and campaigns that were set up once and then left to run without regular review. Fixing one of these in isolation rarely produces the cost improvement you are looking for. Fixing all of them together consistently does.
What’s Inside This Guide
- — Why paid click costs keep rising — the real mechanics behind bid inflation.
- — 10 root causes of wasted paid search spend most advertisers overlook.
- — Informational queries: the silent budget killer hiding in your search terms report.
- — No attribution, no direction — why cross-channel tracking is non-negotiable.
- — Smart bidding, automation, and where most campaigns go wrong with both.
- — Landing page quality and why it affects how much you pay per click — not just how many convert.
- — Split testing methodology that actually reduces cost over time rather than producing inconclusive data.
- — Professional tools for campaign spending optimization and competitive intelligence.
- — The 20-point checklist: what to do first when your costs are too high.
- — Frequently asked questions about paid search cost management.
Why Paid Click Costs Keep Rising — The Real Mechanics
There is a version of this story that gets told a lot in marketing circles: click costs are rising because more advertisers are competing for the same inventory, so prices naturally increase over time. That is partially true but it is also the kind of explanation that sounds complete without actually being useful. Understanding the specific mechanisms that cause your particular account’s costs to rise requires looking at the problem from a different angle.
The auction that determines what you pay per click is not a simple highest-bidder-wins system. It is a quality-weighted auction in which your maximum bid interacts with your Quality Score to determine your actual position and your actual cost. Quality Score is calculated from three components: the expected click-through rate of your ad for a given query, the relevance of your ad to that query, and the post-click experience on your website. When any of these components deteriorates — when your CTR drops because competitors have written more compelling ads, when ad-to-query relevance decreases because your keyword match types have expanded to serve irrelevant searches, or when your website’s landing experience worsens relative to competitors — your Quality Score falls and your effective cost per position increases even if your maximum bid stays exactly the same.
The Quality Score trap most accounts fall into:
Quality Score degrades gradually, not dramatically. Accounts rarely see a sudden collapse — they see a slow creep in average CPC that most advertisers attribute to “market conditions” rather than to the internal account factors that are actually driving it. Monthly Quality Score monitoring at the keyword level is one of the most underused diagnostic practices in professional campaign management, and its absence means most cost increases are attributed to competitors rather than addressed at their actual source.
The second mechanism behind rising costs is impression share erosion. As more advertisers enter a category, the same budget that previously bought adequate impression share begins buying less. The natural response is to increase the budget, which temporarily restores impression share but does not address the underlying inefficiency in how the existing budget is being allocated. Every dollar spent on impressions from irrelevant queries, every click from a geographic area that never converts, and every impression served to an audience segment with poor conversion history is a dollar that should have been reallocated to the high-performing segments of the campaign. Google Ads budget optimization is fundamentally a reallocation exercise rather than a scaling exercise.
Understanding how your competitors are managing their budgets and where they are concentrating their spend is also a necessary input into any cost reduction strategy. The guide on how to find your competitors’ Google Ads budget covers the available data sources and analysis methods for building that competitive picture without relying on guesswork.
10 Root Causes of Wasted Paid Search Spend
Common Causes of Poor Google Ads Performance: Diagnosis and Priority
| Root Cause | How It Wastes Budget | Diagnosis Priority |
|---|---|---|
| Informational query infiltration | Spend on clicks from users researching rather than purchasing — zero conversion value regardless of click volume | Critical — check search terms report weekly |
| Missing cross-channel attribution | Budget decisions made on incomplete data — profitable campaigns get cut, wasteful ones get scaled | Critical — no optimization is valid without accurate measurement |
| Automation without sufficient conversion data | Smart bidding strategies learning from too few conversions produce erratic bid decisions that overpay for low-value clicks | High — check conversion volume before enabling target CPA or ROAS |
| Campaigns set up and abandoned | Ad copy becomes stale, match types drift, negative keyword lists stop expanding — all three increase effective CPC over time | High — review active campaigns at minimum bi-weekly |
| No split testing framework | Underperforming ad variations remain active, draining budget that higher-performing variants would use more efficiently | Medium-high — implement ad rotation with statistical significance thresholds |
| Low-quality landing pages | Poor post-click experience depresses Quality Score, directly increasing cost per position for affected keywords | Critical — landing page quality affects CPC, not just conversion rate |
| Broad geographic targeting | Budget consumed by geographic segments with no conversion history — a problem that compounds silently over time | Medium — review geographic performance quarterly and adjust bid modifiers or exclusions |
| Missing audience bid adjustments | Paying identical prices for clicks from audiences with dramatically different conversion likelihoods | Medium — layer audience segments for observation, then apply bid adjustments based on conversion rate differential |
| Unmanaged search partner network | Search partner traffic often delivers lower Quality Scores and higher CPC with worse conversion rates than Google Search alone | Medium — segment performance by network and disable search partners if their conversion economics do not justify the spend |
| Ad scheduling without performance data | Equal budget distribution across all hours and days when conversion rates vary by two to three times depending on time segment | Medium — analyze day-parting data over 60 days before applying time-based bid adjustments |
Informational Queries: The Silent Budget Killer
Out of all the causes of inflated paid search costs, informational query infiltration is the one that drains budgets most consistently and most silently. The mechanics are straightforward: broad and phrase match keywords capture search terms from users who are nowhere near a purchasing decision. They are researching, comparing, learning, or browsing — and while they may click on a well-written ad out of curiosity, the probability of conversion from this audience is so low that the effective cost per acquisition from these clicks is often ten to twenty times higher than from genuinely commercial queries.
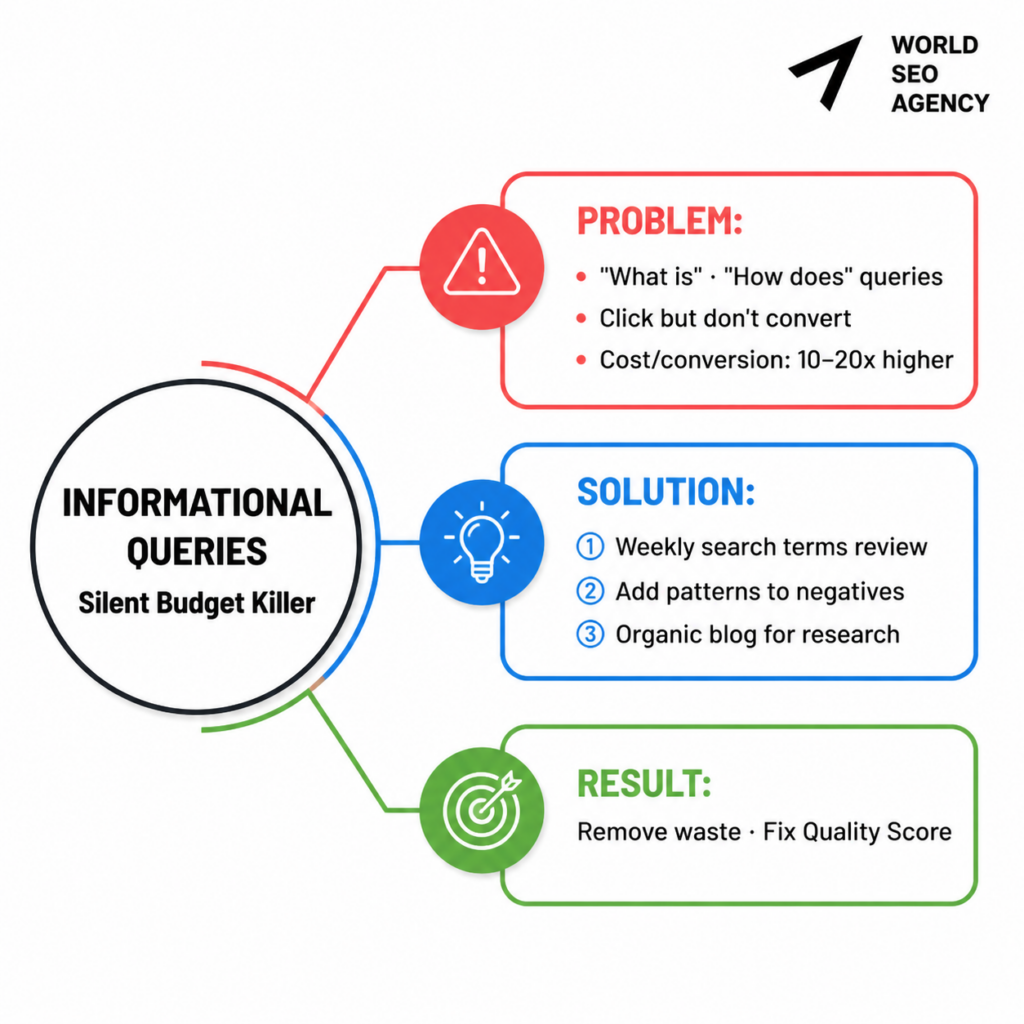
The search terms report in Google Ads is the primary diagnostic tool for this problem. Reviewing it weekly — not monthly, weekly — and adding irrelevant terms to the negative keyword list is among the highest-return maintenance activities available in any account. Most accounts that have not been actively managed for three months or more contain dozens of informational query patterns that are consuming a meaningful percentage of the total budget without contributing meaningfully to conversion volume.
The negative keyword list most campaigns need but do not have:
Beyond the obvious exclusions, most accounts benefit from a structured negative keyword architecture that goes far beyond basic terms. Query patterns that indicate research intent — “what is,” “how does,” “meaning of,” “definition,” “history of,” “vs” without a specific comparative intent — account for a large share of informational traffic in most service categories. Building a master negative keyword list and applying it at the account level ensures that every new campaign benefits from accumulated learning rather than re-encountering the same irrelevant query patterns from the beginning.
The relationship between informational query infiltration and Quality Score is worth understanding explicitly. When your ads appear for queries they are not closely relevant to, the expected CTR for those queries is lower than average. Lower CTR contributes to lower Quality Score, which increases effective CPC across the affected keyword groups. The damage from informational queries is therefore compounding: you pay for useless clicks directly, and those clicks also degrade the Quality Score that determines what you pay for every other click in the same ad group.
This is one of the core reasons why the combination of organic content and paid search is more efficient than paid search alone. A website that has published substantive informational content through a structured blog program captures informational traffic through organic search at zero marginal cost — which means the paid budget can be reserved exclusively for commercial intent queries where conversion rates justify the cost. The practical guide on Google Ads or organic search explores how these two acquisition channels interact and which situations call for which approach.
No Attribution, No Direction — Why Cross-Channel Tracking Is Non-Negotiable
One of the most consistent findings when auditing accounts with escalating costs is that the attribution setup is broken, incomplete, or simply absent. Campaigns are optimizing toward conversion events that do not represent actual business outcomes — micro-conversions that inflate the conversion count without reflecting the qualified inquiries or purchases that actually matter to the business. Or the attribution window is too short to capture the full consideration cycle, making campaigns appear less profitable than they are and causing budget cuts that reduce volume from the highest-performing segments.
Cross-channel attribution — connecting paid search spend to conversions that happen through other touchpoints before or after the paid click — is particularly important in any business with a consideration cycle longer than a single session. A user who clicks a paid ad, leaves without converting, returns directly three days later, and converts on that direct visit will be invisible to last-click attribution models. The paid click that initiated the consideration process gets no credit, and campaigns that depend on those first-touch interactions appear to underperform relative to their actual contribution to revenue.
The hidden conversion volume problem:
Call conversions are consistently undertracked in paid search accounts for service businesses. A user who clicks an ad on mobile and calls directly from the search result — never visiting the website at all — is often not captured by standard conversion tracking that depends on a thank-you page load or a form submission event. Dynamic call tracking numbers connected to the campaign level, integrated with the CRM where calls are logged, are the minimum tracking infrastructure for any service business running paid search at scale.
The practical consequence of attribution gaps is that Google Ads budget optimization decisions are made on incomplete information. The segments that look most expensive in last-click reporting may be the segments that are producing the most first-touch interactions with high-value prospects who convert later through other channels. Cutting those segments based on incomplete attribution data does not reduce waste — it reduces volume from the part of the campaign that is working, while the actual waste in other segments continues unchecked.
Smart Bidding, Automation, and Where Most Campaigns Go Wrong
The automation tools available in modern paid search platforms are genuinely powerful when deployed correctly. They are also capable of producing significant budget waste when deployed incorrectly — which happens more frequently than most advertisers realize. The most common misapplication pattern is enabling Target CPA or Target ROAS bidding strategies before the account has accumulated enough conversion data for the algorithm to make intelligent bid decisions.
Google’s own documentation recommends a minimum of thirty conversions per month for Target CPA bidding to function as intended, and in competitive categories where conversions are harder to come by, many accounts apply automated bidding at lower data volumes where the algorithm is essentially guessing. The result is erratic bid behavior — overbidding on queries that happened to convert once in a small data sample, underbidding on high-intent queries that haven’t yet produced tracked conversions — that increases effective CPC without improving conversion outcomes.
- ➤Conversion volume threshold: Use manual CPC or Enhanced CPC until the account generates at least 30 tracked conversions per month per campaign before switching to Target CPA or ROAS strategies
- ➤Target CPA calibration: Set the initial target at the observed average CPA from the last 30 days rather than an aspirational future target — the algorithm needs a realistic starting point
- ➤Learning period management: Avoid making significant changes during the 1–2 week learning period after any strategy switch — changes reset the learning window and compound the instability
- ➤Portfolio bidding strategies: For accounts with multiple campaigns in the same category, portfolio bidding allows the algorithm to redistribute budget across campaigns toward the highest-converting opportunities rather than optimizing each campaign in isolation
- ➤Automation exclusions: Use campaign-level negative keyword lists and audience exclusions to constrain the automation’s reach to the query and audience territory where performance data supports confidence in the algorithm’s decisions
The concept of Google Ads being too expensive is often actually a symptom of automation applied without adequate data infrastructure — a situation where the platform’s own tools are working against the account’s efficiency rather than for it. For a structured guide to initial campaign configuration that avoids these common automation pitfalls, the resource on how to set up a Google Ads campaign covers the foundational setup decisions that determine how much room for optimization you have later.
Landing Page Quality and Why It Affects What You Pay Per Click
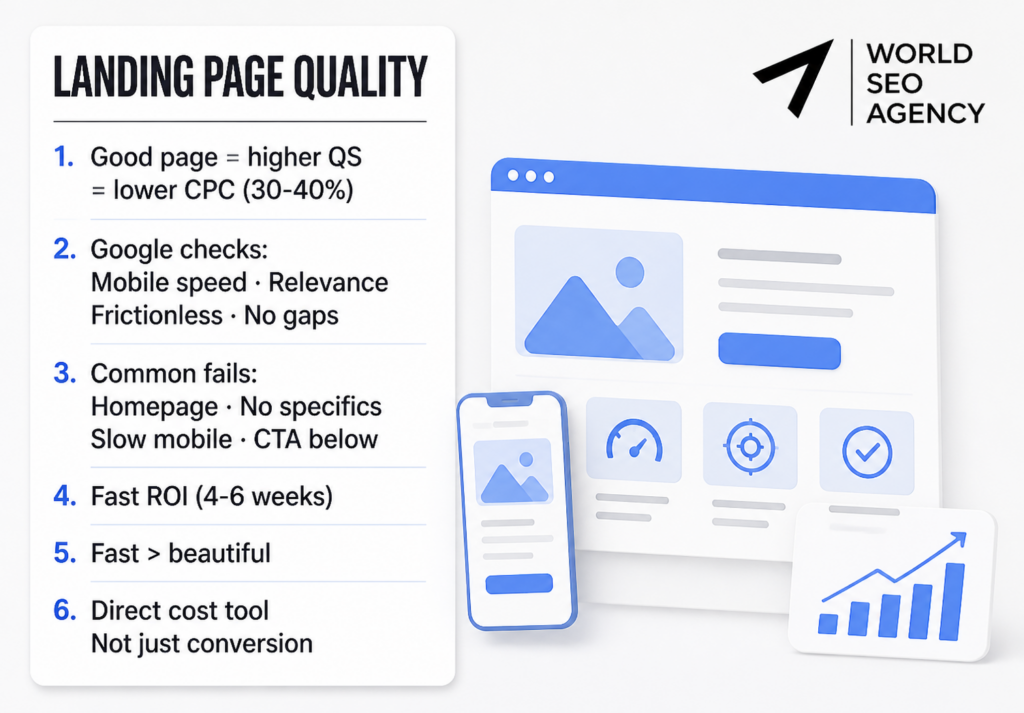
The landing page quality component of Quality Score is the most powerful lever available for reducing cost per click — and it is the one that most advertisers either do not know exists or do not know how to act on. The mechanism works as follows: when Google evaluates the post-click experience that your website delivers for a given query, it factors the quality and relevance of that experience into the Quality Score for the keyword that triggered the ad. A high-quality, highly relevant landing page raises the Quality Score for that keyword, which reduces the bid required to maintain any given position in the auction. A poor landing page does the opposite.
The practical implication is that improving your website’s landing page experience is not only a conversion rate optimization exercise — it is a direct cost reduction tool. A landing page that increases Quality Score from 5 to 8 for a specific keyword can reduce the effective cost per position for that keyword by thirty to forty percent, without any change to the maximum bid. This is the genuine mechanism behind lower CPC Google Ads — not simply bidding less, but earning a lower position cost through superior relevance and user experience signals.
What Google actually evaluates on your landing page:
The post-click experience assessment is not based primarily on visual design. The signals that drive Quality Score improvement are: page load speed on mobile (assessed using Core Web Vitals data), the relevance of the page’s primary content to the query that triggered the ad, the ease with which a visitor can complete the intended action without excessive friction, and the absence of interstitials or misleading content that creates a gap between what the ad promised and what the page delivers. Fast, relevant, and frictionless consistently outperforms beautiful but slow or generic.
Most underperforming landing pages share a small set of structural problems: they are the website’s homepage rather than a page built specifically for the query category that triggered the ad, they do not mention the specific service or location that the visitor searched for, they load slowly on mobile because the development team that built the website prioritized desktop experience, and they place the conversion action below the fold where a large percentage of visitors never scroll to find it. Fixing these structural problems on the highest-traffic pages produces measurable Quality Score improvement within four to six weeks of implementation — which is a faster return on investment than most other campaign optimization activities.
The broader problem of traffic arriving at a website without producing conversions — whether from paid or organic sources — is covered in detail at the resource on why your website gets traffic but no calls. The diagnostic framework there applies equally to paid and organic traffic quality problems.
Split Testing Methodology That Actually Reduces Cost Over Time
Split testing in paid search is practiced incorrectly in most accounts, which means the tests either produce inconclusive results that no one acts on or they produce misleading results because the methodology was flawed from the beginning. The most common error is running too many variations simultaneously with too little traffic per variation — a setup that ensures no individual variation ever accumulates enough data to produce statistically significant conclusions within any reasonable timeframe.
Effective ad testing for cost reduction purposes follows a discipline that most accounts have never applied: one variable at a time, run until statistical significance is reached, pause the losing variation, introduce the next test. The variable most consistently worth testing first for cost reduction is the headline — specifically, whether specific benefit statements in the headline produce higher CTR than generic category descriptions. Higher CTR directly improves the expected CTR component of Quality Score, which reduces effective CPC for the winning variation compared to the control.
The second variable worth testing systematically is the match between the ad’s language and the landing page’s language. When the primary keyword phrase from the ad’s headline appears prominently in the landing page’s above-the-fold content, Google perceives stronger relevance signals and the Quality Score for ad-to-page relevance improves. Testing landing page variants where this mirror relationship is systematically strengthened typically produces both Quality Score improvements and conversion rate improvements simultaneously — the two outcomes that most directly reduce effective cost per acquisition.
- ➤Test duration rule: Never end a split test based on calendar time alone — end it when the variation with the lower confidence interval has accumulated enough impressions to produce a statistically significant result at your chosen confidence threshold
- ➤Rotation settings: Use “Do not optimize: Rotate ads indefinitely” during testing periods — allowing the platform to optimize rotation defeats the purpose of manual split testing methodology
- ➤RSA vs expanded text ad legacy data: When testing responsive search ad configurations, treat each pinned headline combination as a separate test rather than comparing RSAs to other RSAs in their unpinned form
- ➤Metric hierarchy: CTR is a proxy metric — always connect ad variation performance to conversion rate and cost per conversion before declaring a winner based on clickthrough rate alone
Professional Tools for Spending Optimization and Competitive Intelligence
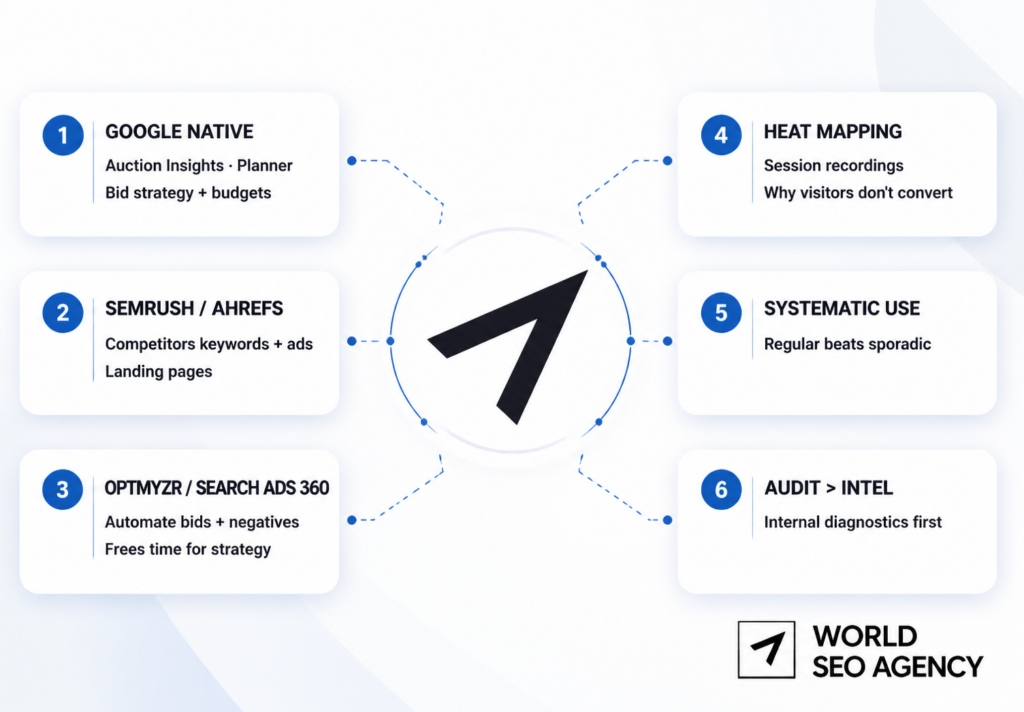
The toolset available to professional paid search managers has expanded significantly, and the practitioners who achieve the most consistent cost reduction results are those who use these tools systematically rather than sporadically. Understanding which tools address which specific problem category prevents the common error of over-investing in competitive intelligence while under-investing in the account-level diagnostic work that drives actual cost reduction.
For account-level audit and opportunity identification, the Google Ads built-in tools deserve more attention than they typically receive. The Auction Insights report, used correctly, shows which competitors are gaining or losing impression share in specific campaign categories — which is actionable data for positioning and bid strategy decisions rather than just competitive curiosity. The Keyword Planner’s historical data is useful for identifying seasonal patterns that should inform monthly budget allocation across the calendar year rather than maintaining flat monthly budgets that over-spend during low-demand periods and under-spend during peak periods.
Third-party tools add dimensions that the native platform does not provide. Semrush and Ahrefs both provide paid search competitive intelligence — specifically, the keyword categories competitors are investing in, the ad copy variations they are running, and the landing pages they are sending traffic to. This data is most useful for identifying categories where a competitor is concentrating spend that you are not matching, which may represent either an opportunity you are missing or a category they have tested and found unprofitable that you should be cautious about.
Optmyzr and Search Ads 360 serve professional campaign managers who need to automate routine optimization tasks — bid adjustments, negative keyword additions, budget pacing management — at a frequency and granularity that is not practical to execute manually across large or complex accounts. The value of automation at the tool level is not in removing human judgment from optimization decisions but in freeing the human manager from the repetitive execution tasks that consume time and attention that should be directed toward the strategic optimization decisions that tools cannot make independently.
For accounts where the website’s conversion performance is the binding constraint rather than the campaign structure, heat mapping tools — Hotjar, Microsoft Clarity — provide the behavioral data that explains why traffic is arriving at a website but not converting. Session recordings of users who clicked paid ads and left without converting are among the most direct sources of landing page improvement hypotheses available, because they show exactly where visitors lose interest, what they were looking for that the page did not provide, and what friction points prevent the conversion action from occurring.
The 20-Point Optimization Checklist: What to Do First When Costs Are Too High
Budget Reduction Checklist: Immediate and Short-Term Actions by Priority
| # | Optimization Action | Expected Impact and Timeline |
|---|---|---|
| 1 | Download and review the full search terms report for the last 90 days — add every irrelevant term to a campaign-level negative list | Immediate cost reduction from eliminated wasteful spend; Quality Score improvement within 4–6 weeks |
| 2 | Check Quality Scores at the keyword level — identify any keyword below 5 and diagnose whether the issue is CTR, ad relevance, or landing page experience | Fixing root cause of low Quality Score reduces effective CPC by 15–40% for affected keywords |
| 3 | Verify conversion tracking — confirm that tracked conversions represent actual business outcomes rather than micro-events that inflate conversion volume without reflecting revenue | Immediate improvement in optimization decision quality; no direct CPC impact but prevents bidding strategy from targeting the wrong metric |
| 4 | Segment geographic performance — identify zip codes or cities with zero conversion history receiving more than 5% of total spend, add bid adjustments or exclusions | Budget reallocation to high-converting geographies typically produces 10–25% improvement in effective CPA within 30 days |
| 5 | Review device performance — compare CPC, conversion rate, and CPA across desktop, mobile, and tablet and apply bid adjustments to reflect actual performance differences | Device bid adjustments typically produce 8–20% CPA improvement for accounts where device performance is highly differentiated |
| 6 | Check the search partners network segment — if CPC is higher and conversion rate is lower on search partners than on Google Search, disable search partners at the campaign level | Immediate — some accounts see 15–30% CPA improvement simply by disabling underperforming partner traffic |
| 7 | Review the Auction Insights report for each campaign — identify competitors whose impression share has increased significantly and evaluate whether their strategy shift requires a response | Strategic insight rather than immediate CPC reduction; enables positioning decisions that prevent further share erosion |
| 8 | Audit ad copy CTR performance — pause any ad with CTR more than 30% below the campaign average; replace with a variation that tests a specific benefit statement rather than a generic category description | CTR improvement of 15–30% typically produces equivalent Quality Score improvement within 4–6 weeks |
| 9 | Check page load speed for the top five landing pages receiving paid traffic — use Google PageSpeed Insights and address any Core Web Vitals failures before other landing page changes | Load speed improvements on mobile produce Quality Score improvement within 4–8 weeks; direct conversion rate improvements typically visible within 2–3 weeks |
| 10 | Review ad scheduling data for the last 60 days — identify hour and day combinations with zero conversion history receiving significant impression share, apply bid adjustments or scheduling exclusions | Day-parting optimization typically produces 10–20% CPA improvement for accounts where conversion timing is concentrated in predictable windows |
| 11 | Add remarketing lists to Search campaigns (RLSA) — apply positive bid adjustments for previous website visitors and previous converters; reduce bids for non-engaged first-time visitors | RLSA typically produces 20–40% lower CPA for returning visitor segments compared to cold traffic at identical bids |
| 12 | Check keyword match type distribution — identify any exact match keywords that are being outbid by the same term in a broad match campaign; consolidate to avoid internal competition | Eliminating internal keyword cannibalization reduces artificial bid inflation and stabilizes CPC for affected queries |
| 13 | Review the change history log for the last 90 days — identify any period where CPC increased significantly and check what campaign change preceded it by 1–2 weeks | Identifies reversible changes that contributed to cost increases; frequently surfaces bid strategy changes or match type expansions that were not monitored post-implementation |
| 14 | Implement ad asset (formerly extension) completeness — sitelinks, callouts, structured snippets, and call assets all improve ad rank at no additional cost and increase CTR | Fully extended ads typically achieve 10–15% higher CTR than ads without extensions, with direct Quality Score improvement effect |
| 15 | Segment campaign performance by audience — layer Customer Match, similar audiences, and in-market segments for observation and identify which audience categories convert at significantly different rates | Audience-informed bid adjustments typically produce 15–30% CPA improvement once 30 days of audience conversion data has accumulated |
| 16 | Check the Recommendations tab — but evaluate each recommendation against account-specific performance data before applying; never apply bulk recommendations without individual review | Selectively applied recommendations improve account optimization score without compromising campaign control; indiscriminate application can introduce budget waste |
| 17 | Review shared budgets — identify any shared budget that is allocating spend disproportionately to lower-priority campaigns at the expense of higher-performing ones | Correcting shared budget misallocation produces immediate improvement in spend distribution without any additional total budget investment |
| 18 | Implement conversion value rules — if your business has different profit margins for different service or product categories, assign conversion values that reflect actual business economics rather than equal-weighted event counts | Value-based bidding produces budget concentration in highest-margin conversion categories; ROI improvement is typically visible within one full learning cycle (2–4 weeks) |
| 19 | Check budget loss vs rank loss in impression share data — campaigns losing impression share due to budget (not rank) need budget increases, not bid increases; bidding up to recover budget-limited share is one of the most common and expensive misdiagnoses | Correctly diagnosing budget vs rank impression share loss prevents unnecessary bid increases that inflate CPC without recovering lost volume |
| 20 | Set a recurring bi-weekly calendar review with a standardized checklist — campaign management without scheduled review cadence reverts to reactive management, which consistently produces higher costs than proactive optimization | Process-level intervention that prevents cost drift rather than correcting it retroactively; accounts with structured review cadences consistently maintain lower CPAs than those managed reactively |
The “set and forget” account deterioration curve:
Accounts that are configured once and left without active management do not maintain their initial performance level — they deteriorate at a predictable rate. Negative keyword lists become outdated as search query behavior evolves. Ad copy becomes stale as competitors refresh their messaging. Bid strategies that were calibrated to a certain conversion volume stop functioning correctly when that volume changes seasonally. The compounding effect of these individual deteriorations typically adds 25–40% to effective CPA over a twelve-month unmanaged period compared to the same account maintained with regular optimization.
What’s Included in Our Affordable SEO Packages? This Is More Profitable and More Sustainable Than Google Ads
| Package | Monthly Price | What’s Included |
|---|---|---|
| START A Profitable Start Get Started → |
from $1,500 / month First result: 3 months |
Website optimization. Top 10 Google rankings. AI (GEO) under Google search. Local SEO with new page creation. Promoted pages: 10. Keywords: 30. |
| BUSINESS Customer Selection ★ Get Started → |
from $2,500 / month First result: 2 months |
Everything in START. Top 5 Google rankings. AI (GEO) optimization. Local SEO with new pages. Promoted pages: 20. Keywords: 100. Regular blog development. Organic backlinks. |
| INDUSTRY LEADER Everything Is Included Get Started → |
from $4,500 / month First result: 1 month |
Full-service SEO. Top 3 Google rankings. AI (GEO) optimization. Local SEO. Unlimited pages and keywords. Regular blog. Organic backlinks. Technical improvements. Paid link building included. Financial guarantee applies to this plan. |
The case for organic search as a complement or partial alternative to paid search is strongest precisely for businesses that are experiencing the cost pressures described in this guide. When click costs are high and rising, the economics of building organic visibility shift in the direction that makes more sense over a twelve-to-twenty-four-month planning horizon. The guide on how to get more online customers without paying for Ads outlines the practical path from paid dependency to a more balanced acquisition mix.
Why World SEO Agency Is the Right Partner for US and Global Businesses

→ 90-Day Performance Commitment
On our top-tier plan, measurable progress against the specific metrics agreed at the start of the engagement is committed in writing within ninety days. If those milestones are not met within that window, we continue working at no additional cost until they are. This is a contract clause, not a sales conversation assurance — and it exists because we assess every project’s competitive starting point honestly before agreeing to it rather than committing to timelines we cannot support with evidence.
→ Affordable Pricing
Our plans are structured at investment levels that reflect what is actually required to produce competitive results in the specific market and category each client is operating in. We do not offer pricing below the floor at which all necessary campaign components can run simultaneously, because the outcome of underfunded campaigns is predictable and not in the client’s interest. What you see in the proposal is calibrated to what the work actually costs to execute correctly — not to a number that closes the sale but cannot support the scope it implies.
→ All-Inclusive System With No Hidden Costs
Every component of our engagements — technical implementation, content production, local optimization work, link acquisition, Google Business Profile management, and monthly performance reporting with business outcome attribution — is included within the stated monthly fee. Tool access costs, content briefing time, reporting software subscriptions — none of these appear as separate line items on the invoice. The number agreed at the start of the engagement is the number on every subsequent invoice throughout the relationship.
→ We Work Across the US and Worldwide
Our client base spans multiple US markets and international clients across Europe, the Middle East, and the Asia-Pacific region. The experience managing search optimization across different national markets, different competitive landscapes, and different platform behaviors has produced a depth of pattern recognition that single-market agencies simply cannot develop. When Google adjusts its algorithm in ways that affect international or multi-regional sites differently than single-country US sites, our team has encountered those effects across enough markets to understand what they mean and how to respond to them systematically rather than reactively.
Want to order SEO services or Google Ads setup and management? Get a consultation from an expert. Submit your request.
❓ Frequently Asked Questions
→ Why does reduce Google Ads spending always feel like it will reduce results — is that actually true?
Only if you reduce spend uniformly. Targeted reduction — cutting wasteful segments and reallocating to high-performing ones — consistently improves results per dollar spent even while reducing total spend.
→ Is it possible to achieve Google Ads budget optimization without switching to automated bidding?
Yes. Manual CPC with structured negative keyword management, audience bid adjustments, geographic exclusions, and consistent split testing can achieve significant cost reduction without relying on automated bidding strategies that require conversion volume thresholds most accounts do not meet.
Automation enhances manual optimization — it does not replace the strategic decisions that produce lasting cost efficiency.
→ My Quality Score looks fine but my CPC keeps rising — what else could be causing it?
Quality Score is reported as a rounded number on a ten-point scale, which masks significant variation within a score level. A keyword scored at seven could be performing closer to six-point-five or seven-point-eight — and that sub-score variation produces different effective CPC calculations. Also check for internal keyword competition between campaigns and match type overlap that inflates bids artificially.
→ How long does it take for landing page improvements to affect CPC through Quality Score?
Google reassesses landing page experience on an ongoing basis rather than on a fixed schedule. Significant improvements — particularly load speed on mobile and above-the-fold content relevance — typically produce Quality Score movement within four to six weeks of implementation, assuming sufficient impression volume for the affected keywords.
→ Is it worth implementing RLSA for a campaign with fewer than 1,000 website visitors per month?
The minimum list size for RLSA is 1,000 users in the observation window, so very low-traffic sites cannot use RLSA effectively. For accounts below that threshold, Customer Match using email lists from the CRM is a viable alternative for implementing audience-based bid differentiation without depending on pixel-based list building.
→ Can ad copy changes cause a temporary cost increase before improving efficiency?
Yes. Pausing an established ad and replacing it with a new variation resets the CTR history for that creative, which can temporarily reduce Quality Score while the new ad accumulates impression data. This is why major ad copy overhauls should be phased — test the new variation alongside the existing one before pausing the control.
→ What is the most common mistake when trying to lower CPC through match type changes?
Moving from broad to phrase or exact match without simultaneously adding negative keywords for the query patterns that the original broad match was capturing profitably. Match type tightening without corresponding negative keyword strategy often reduces impression volume more than it reduces wasted spend.
The two changes need to be made in coordination rather than sequentially to avoid unintended volume loss alongside intended cost reduction.
→ Why does the Google Ads cost per click too high problem often return a few months after fixing it?
Because the fixes applied were tactical rather than structural. One-time negative keyword additions, one-time landing page improvements, and one-time bid adjustments produce temporary cost reduction that erodes as query behavior evolves, competitors update their ads, and seasonal factors shift conversion rates. Sustained cost reduction requires a recurring optimization cadence, not a one-time remediation project.
→ Is there a meaningful difference between reducing spend and improving efficiency — or is it the same thing?
They are different and often in tension. Reducing spend lowers cost but may also reduce volume if the reductions come from productive segments. Improving efficiency lowers cost per conversion without necessarily reducing total conversion volume. The goal of Google Ads cost reduction, properly understood, is efficiency improvement — not spend reduction for its own sake.
→ What signals indicate that a campaign has been “set and forgotten” for too long?
Average CPC trending upward over three or more months without corresponding Quality Score improvement, negative keyword lists unchanged for more than sixty days, ad copy with no paused variations in the last ninety days, and no entries in the change history log beyond automatic recommendations. Any two of these signals together indicate an account in drift.
→ When does it make more sense to pause paid search entirely and invest in organic instead?
When the cost per acquisition from paid search consistently exceeds the gross margin on the converted business, and when the business category has sufficient search volume and manageable competition to build organic visibility within a twelve-to-eighteen-month horizon. The two channels are not mutually exclusive, but when paid economics are fundamentally broken rather than just suboptimal, the organic path deserves serious evaluation as a primary acquisition strategy rather than a complement.